
Africa
Kenya's EV fleet reached an estimated 39,000 units by 2026, with 32,144 of them being electric two-wheelers. But ownership, not adoption, is now the battleground: battery-swap lock-in, the KES 8/kWh e-mobility tariff, and why interoperability is East Africa's defining EV risk.
Executive summary: Kenya’s EV transition adoption solved, ownership remains the battleground
Kenya has one of Africa's fastest-growing EV markets with 32,144 electric two-wheelers registered by July 2026, representing about 90% of Kenya's EV fleet, up 228.2% year-on-year. (The 90% figure assumes a total fleet of roughly 35,000–36,000. Against the 39,000 upper-bound estimate used later in this analysis, the two-wheeler share is closer to 82%).
Electric motorcycles cuts rider costs by 40-50%. Fiscal incentives such as the February 2026 National Electric Mobility Policy, and a subsidized e-mobility tariff (KES 8/kWh off-peak) have accelerated adoption of EVs in Kenya.
Ownership is now the battleground. Batteries, swap infrastructure, and diagnostic data sit with a few vertically integrated operators. Nearly 90% of charging stations are in Nairobi, which generated about 71% of Kenya's KES 382 million e-mobility revenue.
The tariff benefits company-owned depots, not riders' meters. BasiGo keeps bus battery ownership; Spiro, Ampersand, MAX, and Roam run largely closed two-wheeler swap ecosystems. Remote disablement, capped range, and high switching costs are clear risks.
Technicians face a parallel barrier such that proprietary battery data keeps well-paid work inside OEM channels. Kenya mandates green plates and tax incentives but no interoperability standards, risking consolidation into closed, foreign-capitalized ecosystems despite a 10,000-charging-station target by 2030.
This is a regional and continental pattern, not a Kenyan outlier. Ethiopia leads East Africa on fleet size (an estimated 115,000 EVs, ICE import ban); Kenya leads on private capital and startups (50+ firms, about 25,000–39,000 EVs), ahead of Uganda, Tanzania, and Rwanda. Constraints are shared with grid reliability gaps, no interoperability mandates, capital-city concentration.
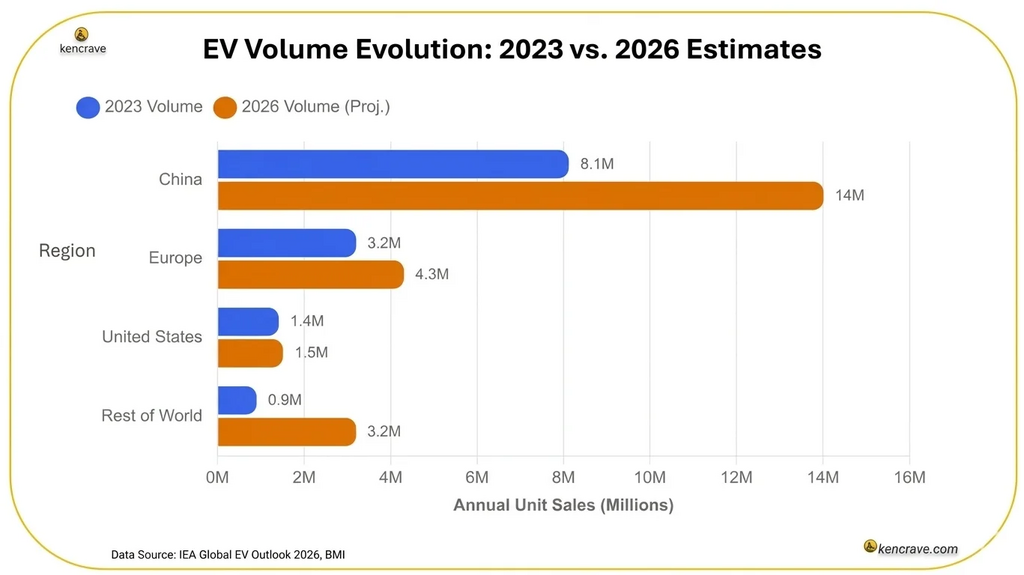
Globally, Africa's EV path is structurally different. China produces 75% of the world's electric cars (est. 14.3M sales projected 2026, 60% share. Europe passed 21% and is tracking toward 30 while the US has stalled near 10%. According to a 2026 mid year report by IEA, Africa’s passenger EV market is small (about 29,000 units, H1 2026). However, its two- and three-wheeler segment is globally competitive with roughly 70,000 units in 2025, an 80-fold rise since 2020. Growth is anchored to Chinese supply chains with BYD's share of Africa's imported electric cars jumping from 4% in 2023 to 35% in 2025.
The structural difference that matters: China, Europe, and the US are converging on regulated, interoperable charging (CCS, NACS, GB/T) for private passenger cars. East Africa is leapfrogging into proprietary battery-as-a-service ecosystems for two- and three-wheelers with no cross-brand mandate.
Africa’s governments have made strides in lowering the financial barriers to accessing EVs and grids are largely renewable. However, the real constraints sit on infrastructure, where a few players control batteries, charging, and data in the Ev market in the region.
The most critical question is not whether demand is solved. The remaining question is whether the EV growth produces an open, competitive mobility environment or a collection of private, proprietary platforms.
The highest‑opportunity, lowest‑lock‑in entry points sit around closed ecosystems. These include certified repair, structural repair, interoperable charging, second‑life batteries, and technician training. Policymakers must close the interoperability gap and extend infrastructure beyond capital cities.
Who should read this analysis: Investors and analysts evaluating Kenya's e-mobility market; technicians and independent workshop owners deciding where to enter; engineers and entrepreneurs assessing viable business models; and policymakers designing interoperability and infrastructure rules.
Access Other Recommended Strategic Analysis: China's EV Rise and Investment Strategy
How Ownership Actually Works: Two Models, One Pattern
Access Other Recommended Strategic Analysis: China's EV Rise and Investment Strategy
How Ownership Actually Works: Two Models, One Pattern
The bus model: BasiGo owns the battery, saccos own the shell
Kenyan e-bus adoption now follows BasiGo's Pay-As-You-Drive concept. BasiGo maintains ownership of the lithium-ion battery, which is leased and paid for at roughly KES 26 ($0.17) per kilometre travelled. Saccos and operators buy the bus shell at a cost similar to that of a diesel vehicle. BasiGo ensures that the buses remain on the road at least 90% of the time, and the per-kilometre cost includes charging, maintenance, insurance, and battery leasing.
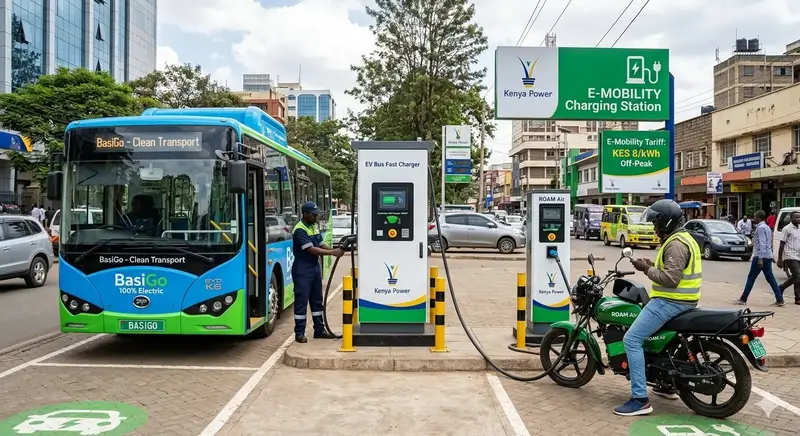
Kenya Power’s off‑peak e‑mobility tariff of about KES 8 per kWh, has been a major enabler allowing operators using this model to cut their operating costs by up to 70% compared to diesel buses.
For operators, structural reliance is the trade-off. A Sacco that adopts the concept has essentially subcontracted its energy costs, maintenance schedule, and uptime guarantee to a single counterparty because BasiGo owns the battery. This is because BasiGo determines the per-kilometre rate and manages the charging depots.
Given the high upfront costs of batteries this could be interpreted as a fair deal for many operators. However, it concentrates commercial risk and bargaining power on one side of the partnership. As a result, there is currently no practical, non-BasiGo way to operate one of these automotives.
The two‑wheeler model represents closed ecosystems
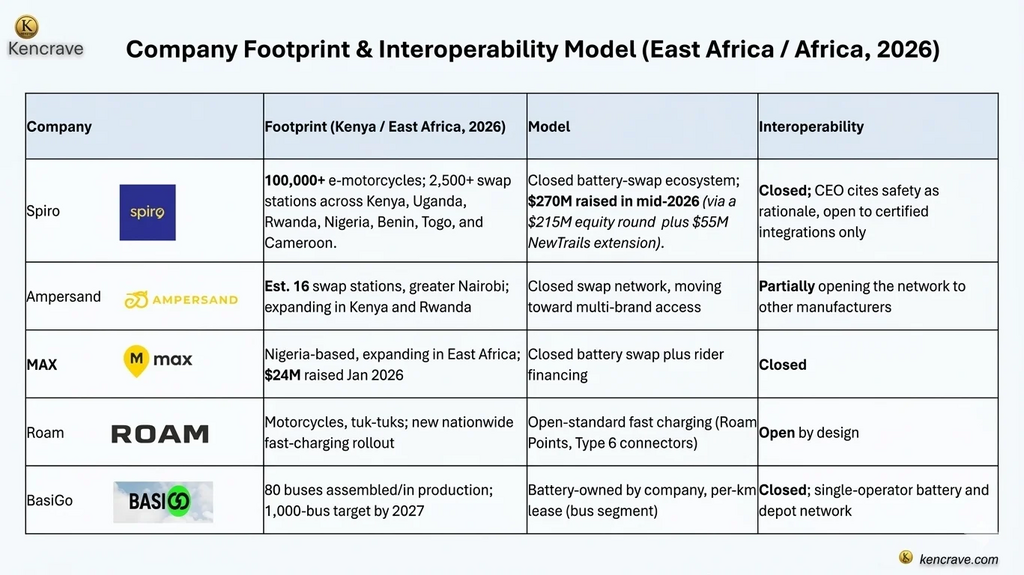
Kenya's EV statistics are mostly driven by electric motorbikes, where the ownership pattern is more pronounced. Leading two- and three-wheeler operators in Africa, such as Spiro (the continent's largest, with over 80,000 e-motorcycles and more than 2,500 swap stations spread across six countries: Benin, Togo, Rwanda, Uganda, Nigeria and Kenya).
Ampersand has about 16 swap stations in greater Nairobi and is growing into a multi-manufacturer network. MAX, and Roam have primarily developed systems where the vehicle, battery, and charging or swap infrastructure only function within the ecosystem of a single brand.
According to Associated Press's report 2026 noted the frustration of riders whose motorcycles can be remotely disabled by the running business after periods of inactivity and batteries that cannot be switched between rival networks. One rider from Nairobi talked about turning down trips when his battery ran low out of concern that he might be stuck outside the swap radius of his network.
This shows how swap networks are turning into infrastructure monopolies by design. Industry estimates indicate that one operator alone controls most of Kenya's sales of electric motorcycle. The company also owns the battery, and the swap station controls the relationship with the rider indefinitely.
Ampersand has stated that it is expanding its swap network to other Kenyan and Rwandan manufacturers. Its new Roam Points network makes use of Type 6 connectors and open-charge standards specifically created for interoperability between two-wheelers, tuk-tuks, and light passenger EVs.
Rather than being an industry standard, these are early, voluntary changes that coexist with the prevalent closed model rather than replacing it.
A Cheap Rate That Most Riders Cannot Access Directly
Approved by the Energy and Petroleum Regulatory Authority (EPRA) in 2023, Kenya Power's special e-mobility tariff gives around KES 16 per kWh during peak hours and KES 8 per kWh off-peak. This is lower than the typical domestic electricity rate, which is roughly KES 20 per kWh.
The tariff is functioning as a revenue signal with cumulative revenue reaching KES 382 million by April 2026. According to Kenya Power, monthly e-mobility income increased from KES 873,907 in July 2023 to a peak of KES 35.25 million in February 2026.
The company forecasts KES 5.9 billion in annual e-mobility revenue by 2030. A major milestone was reached in November 2025 when monthly electricity consumption exceeded one million kWh for the first time. As of 2026, this is a threshold it has consistently maintained.
However, nearly all of that electricity consumption, as well as the associated discounts, passes through company-owned swap stations and charging depots rather than individual riders' meters. Of the KES 382 million in cumulative revenue, Nairobi alone generated roughly KES 271.9 million.
This highlights the heavy concentration of infrastructure in the capital, where the tariff primarily benefits fleet operators, Saccos, and infrastructure companies rather than individual boda boda riders charging at home.
This highlights the heavy concentration of infrastructure in the capital, where the tariff primarily benefits fleet operators, Saccos, and infrastructure companies rather than individual boda boda riders charging at home.
"Electric vehicle charging infrastructure remains heavily concentrated in Nairobi. As we roll out our long-term strategy, it is imperative that we expand this network to other towns and regions across the country."— Mr. Mohamed Daghar, Principal Secretary for Transport.
The mechanism underlying the observed pattern is shaped by the structure of the charging system. Although a discounted national tariff exists to reduce electricity costs, charging is monopolized at the infrastructure layer rather than being distributed directly to individual consumers.
This arrangement stands in contrast to home charging norms that are common in much of Europe and China. As a result, the benefit of the tariff is first captured by the company operating the depot or battery swap station. It is then passed on to the rider or Sacco only in the form and at the margin determined by that company.
The situation is particularly challenging for two-wheeler users. Unlike owners of European or Chinese e-bikes, most of them are unable to charge at home. Consequently, they are fundamentally dependent on switch station operators. Their access to mobility is shaped by the pricing, uptime, and geographic reach of these operators, which makes them more vulnerable to the terms imposed at the infrastructure level.
The Policy Gap: No Mandated Interoperability Standard
Kenya's National Electric Mobility Policy, which was introduced by the Ministry of Roads and Transport on February 3, 2026, is a significant advancement. It pledges to extend charging into additional towns, promote private investment, and integrate charging into real estate, shopping centres, and fleet depots.
It also creates five technical working groups, one of which is devoted to charging infrastructure and grid integration. Kenya’s government has committed KES 6.12 billion ($47.26 million) to support the rollout of electric vehicle infrastructure. Linked to this investment, policy planning projects that e-mobility will generate an additional 415 MW of electricity demand over the next five years.
This growth builds on the existing base of approximately 137 charging and battery exchange sites, which currently serve the market. Looking ahead, the government has set a target of 10,000 charging stations nationwide by 2030, marking a significant scale-up in infrastructure to meet rising demand.
Industry analysis indicate that Kenya's National Electric Mobility Policy does not yet require open charging or battery-swap requirements. According to a 2026 industry analysis of Kenya’s battery-swap market, current regulation mandates the use of green plates and provides tax incentives for electric vehicles. However, it makes almost no reference to open access or interoperability, leaving operators free to design proprietary systems.
Also, technical guidelines on EV charging infrastructure highlight another gap as Kenya is yet to establish mandated standards for charging connectors. The absence of such standards poses a serious risk that every company will promote its own charger. This would reduce accessibility, fragment the market, and ultimately discourage widespread adoption.
Because swap‑based business models are intrinsically proprietary by design, a company’s sustainable edge lies in the battery‑and‑swap relationship with the rider. This gap is therefore more significant in Kenya’s two‑ and three‑wheeler‑dominated market than it would be in a passenger‑car market.
The absence of mandated standards for open access and connector interoperability risks fragmenting the market, reducing accessibility, and ultimately discouraging adoption.
What This Means for EV Owners and Riders
- Cost savings are real but conditional. Riders report saving up to 40% on daily operating costs compared to petrol motorcycles, largely due to cheaper electricity and simpler maintenance. However, these savings depend on the operator’s swap pricing rather than directly on Kenya Power’s tariff.
- Mobility radius is limited by network geography. Since most electric motorcycles cannot be conveniently charged at home, and swap stations remain concentrated in Nairobi and other urban centres, riders are effectively confined to operating within reach of their network’s stations.
- Remote disablement is a commercial risk. Reporting has documented cases of motorcycles being remotely disabled by operators after periods of inactivity. This means an owner’s ability to use a financed or leased vehicle can depend on staying current with one company’s commercial terms, not just on the vehicle’s mechanical condition.
- Switching costs are high. Riders or Saccos that commit to one company’s battery and charging ecosystem cannot easily move to a competitor without effectively refinancing the vehicle and retraining around a new network.
What This Means for Technicians
Expanding EV technical training
Kenya is investing in EV technical skills through multiple channels. Utu Cars and Alison have introduced free EV‑mechanic training, while universities such as the Technical University of Kenya, University of Nairobi, JKUAT, Strathmore, and Kenyatta University now offer EV‑relevant programmes.
In addition, OEM‑linked, hands‑on sessions with partners like BasiGo, EBEE, Ampersand, Powerhive, and Knights Energy are training a first generation of technicians on actual vehicles.
The real barrier: proprietary data
Technicians report that data access is the barrier rather than training access. The information required to accurately determine how degraded a battery is, is primarily proprietary: "For most Chinese vehicles, that information is only available to probably the person selling and not all of them," and OEMs share it with their own distributor rather than making it public.
The reason owners feel compelled to return to the manufacturer for repairs is that corporate return policies restrict independent servicing, effectively making the manufacturer the only authorized option for fixing the product.
Additionally, an independent workshop frequently lacks the diagnostic equipment and battery data that it would require to perform the repair.
Market requirements and job postings
Job postings for EV workshop technicians in Kenya reflect this reality. They typically require:
- A diploma in electrical, mechanical, or automotive engineering.
- Two to five years of practical experience with motors, controllers, and battery‑management systems (BMS).
- Working knowledge of dock interface units (DIU) and battery communication protocols.
These skills are currently taught primarily inside OEMs or their authorised partners, not in the open market.
Near‑Term Employment Landscape
Most well-paid EV technician roles in Kenya sit inside Spiro, Ampersand, Roam, BasiGo, or their authorized service partners, not in independent garages.
- Independent repair is possible for structural, wiring, and non-proprietary electrical faults, but full battery diagnostics and BMS-level fault-finding generally require OEM tools, codes, or certification that most independents cannot yet obtain.
- The credentialing pathway that currently carries the most market value is OEM-linked or certification-based (e.g., manufacturer training tied to Roam, BasiGo, or KenGen/Kenya Power programmes) rather than general automotive-trade qualifications.
What This Means for Engineers and Aspiring Ev Entrepreneurs
In Kenya’s current market, the outlook for an engineer trying to establish an independent EV repair firm is mixed. The addressable demand is substantial and growing. In the boda boda industry, which employs more than 1.5 million people and generates hundreds of billions of shillings annually, electric two‑wheelers already account for up to 10% of new motorbike sales.
However, well‑funded incumbents are capturing the most capital‑efficient part of the value chain through battery ownership and swap infrastructure. Spiro alone has raised more than $150 million since late 2025, while MAX secured $24 million in January 2026. These amounts are far beyond what an independent entrepreneur could realistically match.
The more viable entry points sit around, rather than inside the closed battery ecosystems:
• Certified or franchised repair partnerships: Independent workshops can partner with OEMs or fleet operators such as BasiGo, Roam, Ampersand, or Spiro. These arrangements trade some independence for guaranteed access to diagnostic tools, spare parts, and formal training. This model is already emerging in Kenya and is a realistic pathway for technicians seeking stable work and technical depth.
• Structural and non‑battery repair services: Repairs involving frames, motor housings, brakes, wiring, tyres, and suspension do not require proprietary battery data. This segment is already a recognised and growing trade, and it offers a viable entry point for independent garages without needing OEM diagnostic access.
• Interoperable charging infrastructure: Roam’s adoption of the open Type 6 charging standard creates space for independent operators to install and run publicly accessible chargers. This allows entrepreneurs to participate in the charging ecosystem without competing directly against closed, capital‑intensive swap networks.
• Second‑life battery and diagnostics services: Globally, second‑life battery businesses are emerging as EV fleets age. Kenya will reach this stage once the first generation of leased or swapped batteries begins to degrade at scale. Independent firms could specialise in repurposing, testing, or refurbishing used batteries.
• Technician training and certification delivery: Kenya’s EV fleets are expanding faster than the workforce can keep up. Technicians are not ready, highlighting a clear gap. Independent firms can fill this need by offering training, certification, and upskilling programmes aligned with OEM technologies and local market requirements.
The core strategic risk for a new entrant: The same dependency risk that riders and Saccos currently bear is concentrated when a maintenance or charging company is built around a single manufacturer. Companies that are based on interoperable standards (open charging, non-proprietary diagnostics, structural repair) as opposed to closed ones are the least vulnerable to such risk.
What This Means for Kenya as a Country
The case for e-mobility at the national level is strong in its own right. Kippra reported that data from the State Department for Transport pointed to Kenya’s transport emissions increasing by 59.4% between 2009 and 2019. Kenya has also formally committed to reducing greenhouse gas emissions by 32% by 2030 under its Nationally Determined Contribution (NDC) to the Paris Agreement
Data from World Bank and OEC indicates that Kenya spends an estimated $4 to $5 billion annually importing petroleum, making mineral fuels and lubricants the country's single largest import expense. Over 90% of Kenya’s electricity comes from renewable sources (geothermal, hydro, wind, and expanding solar). Kenya offers EV adoption a real emissions advantage that most other significant EV markets, such as China and much of Europe, cannot directly claim.
However, the government has not yet adequately addressed two structural vulnerabilities associated with a national strategy based on unregulated, vertically integrated private operators.
1. Market concentration
Kenya runs the risk of a transport-energy layer that is privately monopolised. This is similar to how the diesel matatu sector was fragmented and informally controlled. However, the EV market is consolidating around far fewer and far better‑capitalized players. One operator is estimated to hold nearly two-thirds of electric motorcycle sales, and two or three companies control most swap infrastructure.
2. Geographic inequality
The infrastructure for charging and swapping EVs is still largely concentrated in Nairobi, which alone accounts for more than 70% of e-mobility tariff revenue. As a result, the EV transition is currently primarily a Nairobi phenomenon rather than a national one, a gap that the policy specifically recognises but has not yet closed.
Kenya’s incentives duty‑free import of the first 100,000 EVs, VAT and tax waivers, and the e‑mobility tariff have successfully stimulated demand. But the regulations needed to ensure that this demand does not simply consolidate into a few closed, foreign‑capitalised ecosystems remain incomplete. Without clear rules on interoperability and open access, Kenyan owners, technicians, and independent firms will continue to face restricted entry into the transport‑energy layer.
Why Electric Motorcycles Lead EV Adoption in Kenya
Electric motorcycles have become the fastest‑growing segment of Kenya’s EV market, and the reasons are structural, economic, and operational due to the following reasons:
1. High daily utilization and cost sensitivity
Boda boda riders operate on thin margins and extremely high daily mileage. Even small reductions in fuel and maintenance costs translate into meaningful profits. This makes them highly responsive to technologies that lower operating expenses. World bank noted that Kenya’s transport sector consumes 72% of all petroleum products hence any shift away from petrol is immediately felt by riders.
2. Lower upfront costs and faster payback
Electric motorcycles are significantly cheaper than electric buses or vans. Their payback period is often under a year. This is short enough to be attractive even without large financing structures. This aligns with the Kenya’s government push to increase EV uptake as part of its NDC commitments.
3. Swap infrastructure solves charging constraints
Most riders lack access to home charging. Battery‑swap networks eliminate the need for private charging points and allow riders to stay on the road. This model fits the boda boda sector’s operational reality far better than it fits buses or matatus.
4. Rapid scaling by private operators
Private companies have aggressively deployed electric motorcycles and swap stations, especially in Nairobi and peri‑urban areas. Kenya has begun establishing charging hubs in cities like Nairobi and Nakuru, but motorcycles benefit most because they require less infrastructure per vehicle.
Why Public Transport Sectors Lag Behind
Despite Kenya’s ambitions to decarbonise transport, public transport segments that is matatus, buses, and long‑distance vehicles face structural barriers that slow EV adoption. This is attributed to:
1. High capital costs
Electric buses and matatus require heavy upfront investment. Even with incentives, the cost gap remains large. Operators cannot easily replace fleets without financing mechanisms that match their cash flow.
2. Charging infrastructure is not yet sufficient
The Climate Analytics analysis emphasizes that rolling out charging infrastructure is critical for EV uptake. Kenya’s grid can support increased electrification without requiring new generation capacity but the physical charging network for large vehicles remains limited. Heavy vehicles need high‑capacity chargers, depot‑based charging, and predictable routes. However, none of this is yet widely available.
3. Operational constraints
Public transport vehicles run long routes, carry heavy loads, and operate for extended hours. Current EV bus ranges and charging times do not yet align with the duty cycles of matatus or long‑distance buses.
4. Fragmented ownership structures
The matatu sector is highly fragmented and informally organized. Coordinated fleet electrification requires collective investment, standardization, and route planning. These are conditions that are difficult to achieve without formal consolidation.
5. Regulatory Priorities Are Still Emerging
Kenya’s NDC highlights BRT, NMT, and rail as key decarbonisation pathways. Electrification of public transport is part of the plan, but policy and infrastructure efforts have so far focused more on motorcycles as they are easier and cheaper to electrify at scale.
Comparative Growth: Kenya And East Africa Vs. Africa, China, Europe, And the U.S
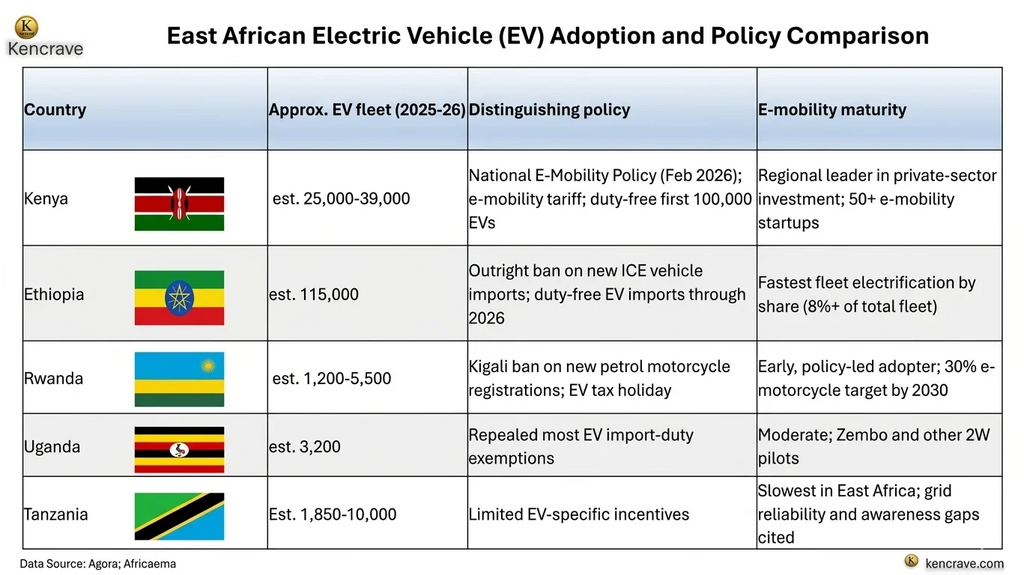
Although estimates vary by source and methodology, Ethiopia is by far the largest single market for registered EVs in East Africa. This is driven by an outright ban on new internal combustion engine vehicle imports that has pushed its fleet past 115,000 units.
However, Kenya has emerged as the region’s premier private-sector e-mobility hub and premier EV test market. While its total registered fleet (est. 25,000–39,000 units, with 32,144 electric two-wheelers confirmed as of July 2026) is smaller than Ethiopia's state-led deployment, Kenya’s market boasts a higher concentration of private venture capital and over 50 startups.
It maintains a larger EV fleet footprint than Uganda (about 3,200), Tanzania (roughly 1,850-10,000 depending on the inclusion of two- and three-wheelers), and Rwanda (approximately 1,200-5,500).
Africa vs. China, Europe, and the United States: Different Growth Engines
Although there is still a significant scale disparity between Africa and the three biggest EV markets in the world, there are strategically significant differences in the growth patterns.
China manufactures about 75% of the world's electric cars, with exports (including to Africa) likely to double by end of 2026. China recorded approximately 13.2 million domestic electric car sales in 2025, and volume is projected to reach about 14.3 million units in 2026. This rapid growth ensures that electric vehicles will securely capture more than half of all automobiles sold domestically in 2026, with the market share expected to reach nearly 60% (IEA, global ev outlook 2026).
Due to stricter EU CO₂ regulations, sales of electric vehicles in Europe increased by more than 30% in 2025, lifting the EV market share past 21% and positioning it to clear 30% moving through 2026. However, intense pressure to soften these carbon rules to protect legacy European automakers from highly competitive Chinese EV imports could decelerate this momentum. Meanwhile, the United States' EV share has remained virtually unchanged, hovering just around 10% as the market navigates evolving federal tax credit guidelines.
Africa's electric passenger car market remains relatively small but is expanding rapidly, more than doubling to exceed 30,000 vehicles in the first half of 2026, with South Africa and Egypt driving the majority of this initial growth (IEA).
However, the continent is truly competitive on a global scale within the electric two- and three-wheeler segments. African electric two-wheeler sales reached approximately 70,000 units in 2025, marking a staggering 80-fold increase since the beginning of the decade. While electric three-wheelers now account for more than 25% of a declining overall three-wheeler market.
Africa’s transition to EVs is heavily anchored to external supply chains rather than domestic manufacturing capabilities. For instance, the share of electric cars imported into Africa from Chinese manufacturer BYD skyrocketed from 4% in 2023 to 35% in 2025. This underscores the deep reliance of African EV growth, notably in hubs like Kenya, on Chinese vehicle and battery supply networks.
Key insights with strategic implications
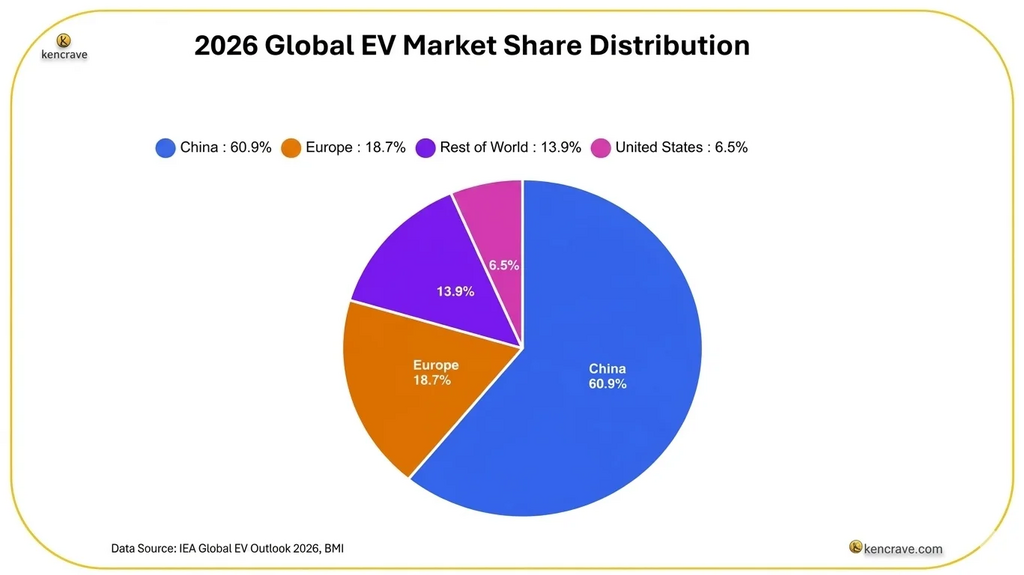
- China commands a 60.9% global EV market share, underscoring its dominance as the world’s electric mobility hub. This leadership stems from large‑scale manufacturing, strong domestic demand, and aggressive government incentives. This positions China as the benchmark for cost efficiency and innovation in EV production.
- Europe, with 18.7%, continues to expand through sustainability‑driven policies and carbon‑neutral goals. Its focus on charging infrastructure and cross‑border interoperability makes it the second‑largest EV ecosystem, emphasizing long‑term resilience and regulatory leadership.
- The United States, at 6.5%, shows slower growth despite major investments, reflecting policy fragmentation and infrastructure lag. Strategic implication: U.S. automakers must accelerate battery supply chains and consumer incentives to remain competitive.
- The Rest of the World (13.9%), including emerging markets in Africa, Latin America, and Southeast Asia represents the next frontier for EV expansion, where affordability, grid reliability, and localized production will define success.
Key Takeaway: Global EV adoption is highly concentrated, with China and Europe shaping technology standards and supply chains. For emerging economies, the opportunity lies in regional partnerships, battery‑swap innovation, and policy harmonization to capture future market share.
The structural difference that matters most
In the United States, Europe, and China, electric‑vehicle expansion is built around privately owned passenger cars. These markets rely heavily on home charging and on regulated, highly interoperable public networks such as CCS, NACS, and GB/T. This creates a predictable, standardized charging ecosystem that supports mass adoption of personal EVs.
The majority of East Africa’s e‑mobility growth is driven by commercially operated two‑ and three‑wheelers. These vehicles run inside vertically integrated, proprietary battery‑swap ecosystems where no cross‑brand interoperability mandates currently exist.
Strategic Recommendations for Key Stakeholders in Ev Space
For Riders, Saccos, and Fleet Operators
- Treat network coverage and remote-disablement terms as core purchase criteria, not fine print, when choosing between BasiGo, Spiro, Ampersand, MAX, or Roam.
- Favour operators moving toward open standards (Roam's Type 6 network, Ampersand's cross-manufacturer access) where routes or use cases allow to reduce single-vendor dependency.
For Technicians
- Prioritize OEM-linked or certification-based training (Roam, BasiGo, Kenya Power/KenGen-affiliated programmes, DIYguru/emobility. academy tracks) over general automotive courses since diagnostic and BMS access currently gates most well-paid EV repair work.
- Build competence in structural and non-proprietary electrical repair now. This is the segment least exposed to OEM data restrictions and already has clear market demand.
For Engineers and Entrepreneurs
- Evaluate certified-partner repair models before attempting a fully independent EV workshop. Proprietary-diagnostics barrier is a real limitation on independence in the current market, not a temporary one.
- Keep an eye on Roam’s rollout of open charging and Ampersand’s move toward cross‑manufacturer battery access. These two efforts are the strongest real‑world tests of whether an interoperable, non‑captive business model can scale in Kenya between 2026 and 2028.
- Consider charging infrastructure, structural repair, and technician training as the three highest-opportunity, lowest-lock-in entry points identified in this strategic analysis.
For Policymakers
- Close the interoperability gap highlighted by industry and technical reviewers. Kenya already has strong fiscal incentives and a clear grid‑readiness plan, but it still lacks mandatory standards for open charging connectors and battery‑data access.
- Extend charging and swap infrastructure investment with geographic targets outside Nairobi.
Bottom Line
East African governments have removed most financial barriers, driving a sharp rise in electric vehicle registrations. Furthermore, the region’s power grids rely heavily on renewable energy, making electrification an environmentally compelling choice.
However, the real constraints sit squarely on the infrastructure side. Frequent power outages disrupt charging and battery-swapping networks, while a total lack of technical interoperability has allowed a few vertically integrated private companies to control most batteries, charging docks, and essential diagnostic data.
With no current legal framework forcing these proprietary networks to open up, market numbers in countries like Kenya will continue to rise. Yet, the broader ecosystem risks remaining structurally closed to independent technicians and local entrepreneurs. This unique mix of grid reliability challenges and platform lock-in is fundamentally different from the heavy grid-capacity strains faced by the US, Europe, or China, and it will ultimately dictate who truly benefits from the region's e-mobility boom.
Key Takeaways
- Africa's EV growth is a two-wheeler story, not a four wheeler one.
- Kenya leads East Africa in private EV capital; Ethiopia leads in fleet electrification.
- Battery-swap lock-in is Africa's defining EV risk.
- Chinese supply chains anchor African EV growth
- Global EV momentum is diverging by region.
FAQs About EV in Africa and Globally
1. Which country has the largest EV fleet in East Africa?
Ethiopia, with roughly 115,000 registered EVs, driven by an outright ban on new internal combustion engine vehicle imports.
2. How fast is Africa's electric two-wheeler market growing?
Sales reached approximately 70,000 units in 2025 representing an 80-fold increase since the start of the decade, making it the continent's most globally competitive EV segment.
3. Why is Africa's EV charging model different from Europe and China?
Africa's e-mobility is built on commercially operated battery-swap networks for two- and three-wheelers, not home charging and interoperable public networks for private passenger cars.
4. What share of global electric cars does China produce?
China manufactures about 75% of the world's electric cars, with domestic sales projected to reach 14.3 million units in 2026 and nearly 60% market share.
5. Which countries are driving Africa's electric passenger car growth?
South Africa and Egypt account for most of the continent's electric car sales, which more than doubled to exceed 30,000 units in the first half of 2026.
Sources
This analysis draws on company and utility disclosures, government policy documents, regulatory filings, multilateral datasets, and specialist reporting. Figures were cross-checked against multiple sources where possible. Where estimates vary by source such as Kenya's total EV fleet, the analysis states the range and identifies which figure applies to which calculation. Several 2026 figures are projections or mid-year estimates, not audited totals not unless where explicitly stated to be audited figures.
- Kenya Power Newsroom, "Kenya Power kicks off customer transition to e-mobility tariff," 2026
- Ministry of Roads and Transport, "Kenya Launches National Electric Mobility Policy," February 2026
- Ministry of Roads and Transport, "State Department Strengthens Stakeholder Engagement on the National Electric Mobility Policy," 2026
- Ministry of Transport and Logistics (Ethiopia), "E-Mobility Strategy and Implementation Plan," 2025
- Republic of Kenya, “Kenya's Updated Nationally Determined Contribution (NDC 3.0),” submitted to the UNFCCC, April 30, 2025
- International Energy Agency (IEA), “Global EV Outlook 2026: Executive Summary,” 2026
- NDC Partnership, "Kenya," 2026
- World Bank, "Kenya Petroleum oils, etc, (excl. crude); preparation imports by country," World Integrated Trade Solution (WITS), UN Comtrade database, 2023
- IntelliNews, “China’s BYD captures 35% of Africa EV market, as latecomer rival Tesla bets on Morocco,” 2026
- AP News, "E-bike riders demand more flexible battery networks," 2026
- TechPoint Africa, "Africa EV energy grid war: How Spiro & MAX are building battery swap empires," 2026
- Electrive, "Spiro secures $50 million for electric motorcycles and battery swapping," 2026
- CleanTechnica, "Roam Launches Charging Network for Electric Motorcycles & Tuk-Tuks In Kenya," 2025