U.S. housing market 2026: median price $417,700, mortgage rates at 6.51%, but sharp regional divides. Explore housing fragmentation, rate lock-in, and what it means for buyers and investors.
Executive Summary
The U.S. housing market in 2026 is deeply fragmented, no longer a single national market but a collection of divergent regional systems. While the median home price sits at roughly $417,700 and mortgage rates have eased slightly to 6.51%, national averages hiding sharp regional contrasts.
National policies may fail to address local realities. An estimated 69% of top metro areas are overvalued, raising correction risks. Without coordinated local, state, and federal action, regional inequality is likely to deepen.
An Overview of a Fragmented Housing Market in the U.S., 2026
Housing fragmentation has become more evident in the U.S. in 2026, with the Northeast and Midwest parts of the country seeing strong price increases, while parts of the South and West experience decline in house prices.
Nationally, the median home price is about $417,600. The mortgage rates in the country have remained around 6.51% (June 2026), and affordability has slightly improved. However, significant disparities across regions illustrate a deeply divided housing market (NAR, 2026).
What is Housing Fragmentation?
Housing fragmentation describes a point where housing market prices perform differently across different geographical regions, property types, and group of buyers. Instead of following a single national trend, the U.S. housing market now indicates sharp contrasts in pricing, demand and affordability.
According to the US Housing Market Statistics (2026), the market is currently in a phase of rebalancing. This is represented by the following patterns:
Significant affordability differences between metropolitan areas.
Widening gaps between renters and homeowners.
Localized micro-markets influenced by zoning rules, income levels, and investment flows.
Rather than one national housing market, the US now operates as thousands of localized markets with different rules, price trends, and access challenges.
National Overview Inclusive of Q1 (2026)
Median existing-home price: $417,700 (+0.3% year-over-year)
Mortgage rates: 30-year fixed at 6.51% (lower than 6.65% in 2025 though still high)
Existing-home sales: 4.02 million annualized (an increase of 1.7% from January 2026)
Inventory: 723,460 single-family homes listed in early April 2026
Affordability Index: 110.6, the highest since March 2022, with mortgage payments falling below 30% of median income (US Housing Markets, 2026)
Examples of Regional Fragmentation
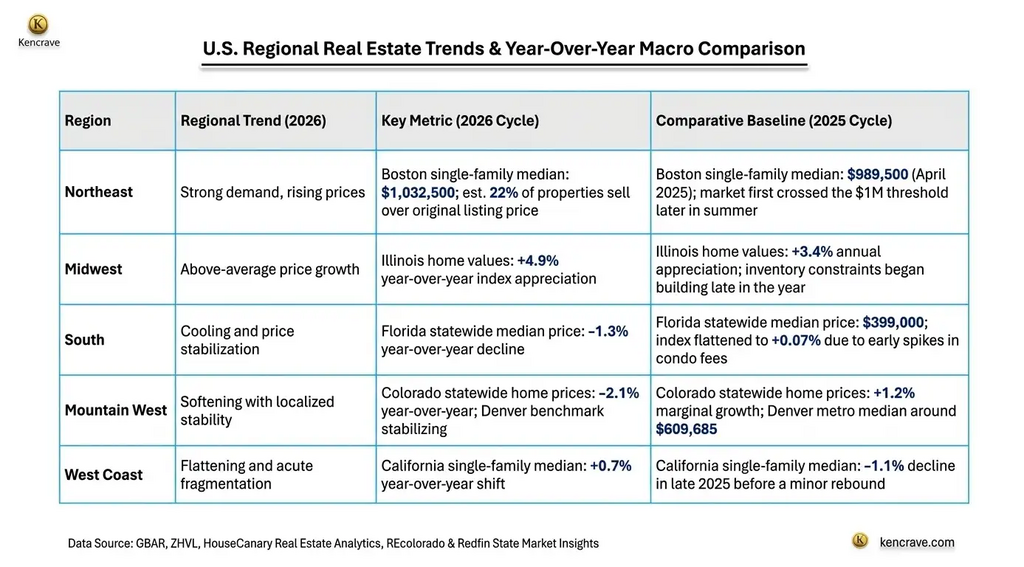
The table below highlights a few of regional fragmentations.
U.S. regional real estate trends 2025 vs 2026 showing price changes across Northeast, Midwest, South, Mountain West, and West Coast housing markets.
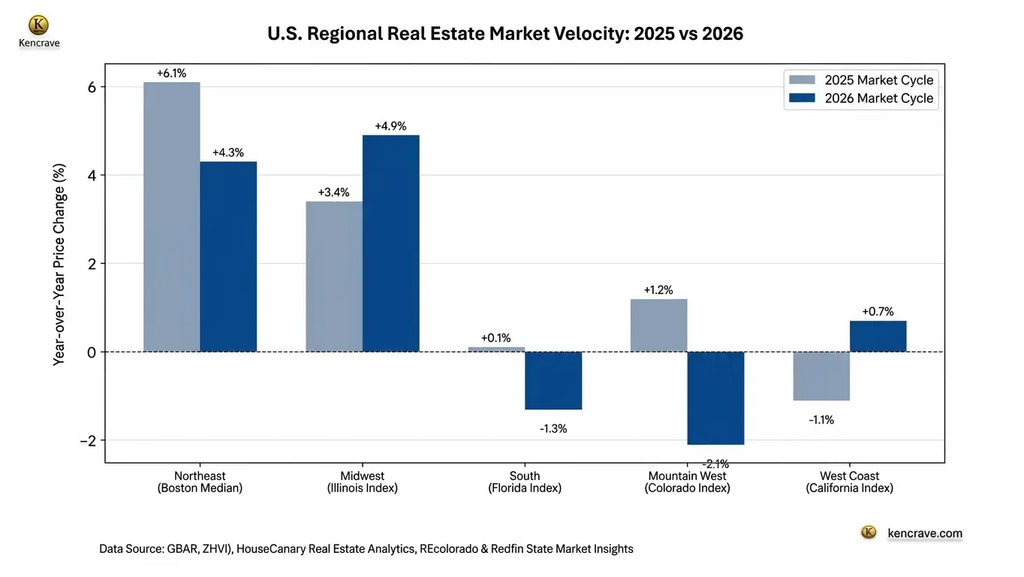
Bar chart comparing 2025 and 2026 regional real estate market trends in the U.S.
Key Insights and Takeaways
Midwest Acceleration: The Midwest especially Illinois saw the strongest price growth, rising from +3.4% to +4.9%, driven by lower inventory costs that attracted buyers priced out of other regions.
South & Mountain West Reversals: Florida and Colorado both slipped into negative price growth as of Q2 2026, pressured by soaring condo insurance costs and an oversupply of higher‑end homes.
West Coast Stabilization: California completed a small correction, moving from a –1.1% decline in late 2025 to a flat but uneven +0.7% in 2026.
Drivers of Housing Market Fragmentation
Housing market fragmentation in the USA in 2026 is caused by uneven effects of mortgage rates, homeowners who locked in low-rate loans, regional supply and demand imbalances, and changing affordability patterns.
These factors are creating a two-way market where some regions thrive while others remain in a stagnation zone.
1. Mortgage Rate Pressure - Rates stay elevated at around 6.4–6.6%, slowing purchase applications and pending sales. The impact is not uniform in all regions. Northeast Metro areas like Boston continue to see strong absorption rates above 20%, while parts of the South and West face stalled transactions. Higher borrowing costs affect first-time buyers and lower-income households more.
2. Locked-In Homeowners - Millions of homeowners refinanced at 3–4% rates between 2020 and 2021 and are reluctant to sell. This "rate lock-in" reduces resale inventory, maintaining higher prices in some areas despite weaker demand. It creates a dual market where sellers with low-rate mortgages stay put, while new buyers face high financing costs.
3. Regional Supply Dynamics - Post-pandemic construction in the South and West cooled prices, while limited supply in the Northeast and Midwest keeps competition high.
4. Affordability Misalignment - Even with slight easing of rates, affordability improvements do not always result into increased sales. In many metro areas, home prices remain misaligned with local incomes preventing buyers from entering the market.
5. Demand Conversion Issues - National demand is present but the conversion rates are decreasing as more deals stall before closing. Rising relist rates indicate friction between contract and closing, especially in cooling regions.
Implications of House Market Fragmentation
Policy challenges: National housing policies may fail to address local realities.
Investor strategies: Opportunities vary greatly with strong rental demand in cooling regions vs. capital gains in hot markets.
Social impact: Rising inequality as some regions remain unaffordable while others stagnate.
Risks and Trade-offs
Overvaluation: An estimated 69% of top metro are overvalued thus risking market corrections.
Stalled transactions: Relist rates are rising, showing deals failing to close.
Regional inequality: Wealth concentration in the Northeast and Midwest vs. affordability challenges in the South and West.
Policy Responses and Ongoing Debates
Efforts to address housing fragmentation include:
Zoning reform initiatives such as upzoning single-family neighborhoods in California and Oregon.
Inclusionary zoning mandates for affordable housing
Federal incentives for housing construction
Rent stabilization policies in selected cities
However, these policies face resistance from local governments and homeowners worried about density, infrastructure strain, and property value effects.
High Rates Trigger Sharp Decline in Refinancing Activity
As of March 2026, refinancing applications have declined to their lowest level since 2000 (Mortgage Bankers Association). Because interest rates remain above 6.5%, most homeowners don’t see any benefit in refinancing.
This situation keeps them locked into their current loans, limiting the number of homes available for resale and making the housing market more fragmented.
Summary
Housing fragmentation in the USA reflects a market in transition: slowing nationally but sharply splitting across regions. While affordability has improved slightly, the uneven distribution of demand and pricing power highlights the need for region-specific housing policies and careful investment strategies.
The inequalities in the housing sector are driven by wealth concentration. Despite claims that the housing market is growing, there is a gap in wealth distribution affecting demand, suggesting otherwise.
Housing is no longer a single national market but a collection of distinct systems. Without coordinated policy efforts at the local, state, and federal levels, these divisions are likely to deepen, further enforcing inequality and limiting economic mobility in the future.