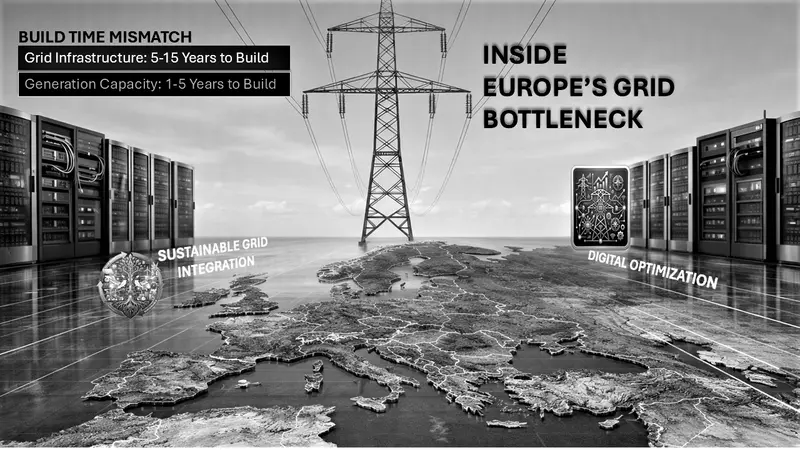
Europe grid bottleneck infographic showing power transmission tower, data centers, and build time mismatch between grid infrastructure and generation capacity. Image Credits: Kenneth Njoroge via Kencrave
27 min read
Business
Europe's Grid Bottleneck: Inside The €584 B Bet On Ai, Digitalization, And Renewable Absorption
Europe's grid bottleneck is the root of curtailment, data center queues, and price volatility. This strategic analysis covers Europe's policies, China comparison, and AI solutions.
EXECUTIVE SUMMARY: EUROPE'S RENEWABLE ENERGY CHALLENGE AND THE GRID ABSORPTION CRISIS
Europe's renewable energy problem has shifted from generation to absorption. The EU can now build solar and wind capacity faster than it can move, store, or connect that power. This is now the root cause of curtailment, price volatility, and multi-year data center connection queues across the continent. Grid infrastructure takes 5-15 years to build against 1-5 years for generation. This represents a mismatch and no amount of funding can close on a faster timeline.
Curtailment already costs the EU an estimated €8.9 billion a year and wastes enough renewable power to run Austria for a year. The European Commission estimates the EU will require roughly €584 billion ($663 billion) in grid investment by 2030 to modernize transmission and distribution networks.
National responses to the related data-center queue crisis differ sharply by country, from the Netherlands' outright exclusion of hyperscale build to Ireland's supply obligations to Denmark's outright pause on new connections. China's parallel, infrastructure-first approach offers a genuine but imperfect contrast.
China has not solved the same problem but chose a different strategy for closing the gap, and its own renewable-heavy provinces still carry billions of dollars in curtailment losses. The EU's June 2026 AI and digitalization roadmap is best read as a rate-of-fix bet. Software and market rules can be deployed in months where transmission lines take a decade.
The analysis core recommendations: Engineers shouldn’t just know power systems (like grids, transmission, energy infrastructure) or just AI/data (like machine learning, optimization, analytics). They should apply advanced data and AI techniques to modern power systems as noted by the EU Horizon Programs. Investors and decision-makers should treat the Netherlands, Ireland, and Denmark's diverging policy responses as trackable natural experiments over the next 2-3 years, rather than waiting for a single settled EU model to emerge.
EUROPE'S RENEWABLE CHALLENGE: WHY MANAGING POWER IS NOW HARDER THAN MAKING IT
For the past two decades, Europe's energy question was essentially “how do we build enough renewables?” On generation alone, that question is close to answered: the EU added more solar and wind capacity in the past three years than in the previous ten combined, and 2026 has produced a string of continental generation records. But generation success has outpaced the continent's ability to move, store, and absorb the power it now produces.
The same pattern is hitting multiple countries at once. They’re seeing record clean‑energy generation but also record price volatility. They’re facing record levels of curtailment, yet at the same time record‑long connection queues for the data centers. For Europe as a bloc, the binding constraint on the energy transition is no longer about whether it can build enough renewables. It is whether its more than 27 national grids, planning regimes, and market rules absorb what's already being built, fast enough to matter.
The 5-15 Year Grid Infrastructure Bottleneck: Why Transmission Can't Keep Pace with Renewables
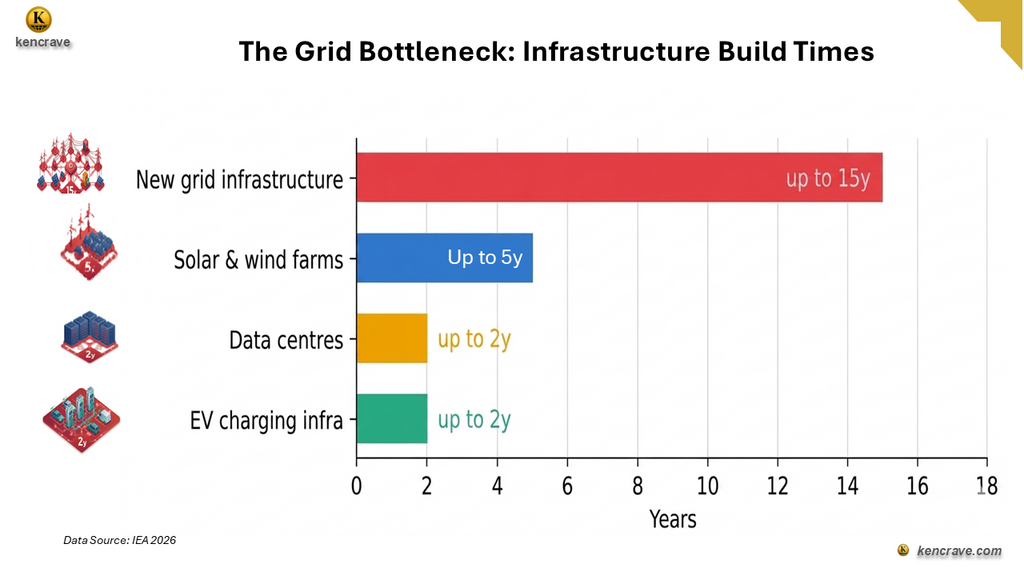
According to IEA 2026, solar and wind farms can be permitted and built in 1-5 years. New transmission and distribution infrastructure means the wire cables needed to move that power to where it's used, takes 5-15 fifteen years to plan, permit, and construct. That asymmetry, not any shortage of turbines or panels, is a major cause of curtailment.
Energy infrastructure build time chart showing grid, solar, data centers, and EV charging delays.
Because grid infrastructure cannot be accelerated to match generation and demand growth, permitting and construction timelines are largely fixed by physics, planning law, and supply chains. IEA notes that more than 2,500 GW of renewable, large-load, and storage projects are currently stalled in grid queues worldwide.
WHERE POWER IS WASTED: CURTAILMENT IS A LOCAL PROBLEM, NOT A CONTINENTAL ONE
Europe's waste of renewable energy is true but there is more to this truth. The mechanism, scale, and trend differ sharply by country and even by year within the same country, depending on weather.
The 2026 Solar Challenge: Record Generation, Record Waste
Through the second quarter of 2026, Europe generated a record 129 TWh of solar electricity, almost 20% more than in any previous second quarter, with Spain, France, and Germany each setting fresh generation records.
Negative electricity prices became more common as excess generation flooded the grid. According to the IEA, about 6% of all hours in 2025 in France, Germany, the Netherlands, and Spain saw prices drop below zero. This is roughly double the 3-5% figures seen in 2024, with Q1 2026 alone already showing more than double the negative-price hours of Q1 2025. Midday solar output was so high with negative values reported in some days.
Weeks later, the scenarios changed. Successive June and July heatwaves pushed temperatures above 40°C across parts of Europe, spiking cooling demand while simultaneously reducing output from nuclear, hydro, and thermal plants stressed by the heat.
Day-ahead prices in Italy and Spain hit their highest levels since the 2022/23 gas crisis. Italy's weekly average electricity price climbed above €160/MWh in several weeks of summer trading, with solar covering daylight demand well. Scarcity and high prices concentrated in the evenings once solar generation stopped and air conditioning stayed on.
The lesson isn't that solar failed as Ember's analysis credits record solar output with helping stabilize the grid through the worst of the heat. This shows that adding solar panels alone doesn't solve the operational problem, a grid can waste record renewable output at midday and pay record prices for gas-fired backup at 8 pm in the same week.
Germany Solar Curtailment 2025: A Multi-Year Trend
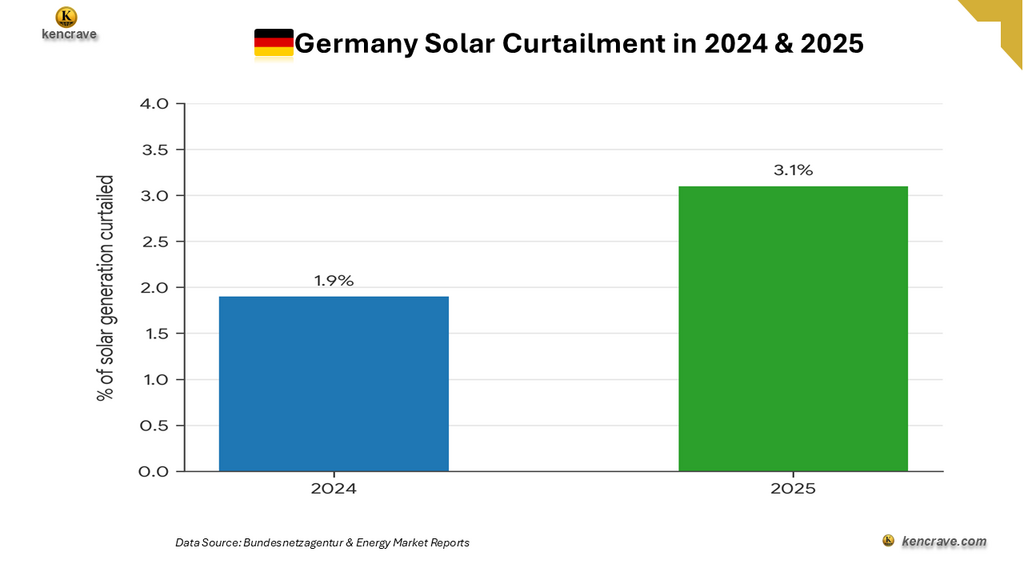
Germany is the EU's largest solar producer. According to Germany Federal Network Agency (Bundesnetzagentur) its curtailment rate nearly doubled in a single year. It doubled from 1.9% of solar generation curtailed in 2024 to 3.1% in 2025. Photovoltaic (PV) systems in Germany had to be curtailed 94% more in 2025 than in the previous year.
This is close to 4% of the combined generation from those two sources that year. The issue reflects standard transmission congestion. Solar and wind generation are concentrated in the north and southeast, while major demand centers and existing transmission lines are not designed to move such large volumes of power quickly enough to the south and west.
Germany solar curtailment chart comparing 2024 and 2025 generation reduction percentage.
Bayern remains a hotspot, accounting for more than half of all curtailments in Q2 2025, a 90% increase over Q2 2024 and a 247% increase over Q2 2023. The development is directly linked to massive PV expansion; in the first nine months of 2025, more than 3,000 MW of solar PV was newly installed in Bayern alone.
The Nordic Drop in 2026 Was About Weather, Not Policy
In 2026, several markets such as the Netherlands, Belgium, Switzerland, and Poland saw commercial curtailment decrease. The reason was not better grid management, but weather was a key factor. A Nordic hydrological deficit (Norwegian snowpack near a 20-year low, reservoirs well below normal) lifted wholesale prices.
It largely removed the oversupply conditions that drive negative prices and curtailment. This could be treated as a methodological caution, not evidence of a solved problem. A single year of lower curtailment in one country does not indicate a structural fix. Weather‑driven hydro shortages can temporarily hide an underlying transmission constraint for a season. Germany's two-year trend is a more reliable signal than any single country-year view since it isolates the structural factor from weather noise.
CHINA’S GRID INFRASTRUCTURE STRATEGY VS. EUROPE: MORE TRANSMISSION, SAME CURTAILMENT PROBLEM
Europe is not the only power system dealing with too much renewable generation and not enough grid to move it. China faces a structurally similar problem. It has vast renewable resources concentrated far from demand centers and its response presents the ground for response to Europe’s power system.
China's Infrastructure as National Project: 15 New UHV Lines by 2030
China added more wind and solar capacity in the past two years (2024 to 2025) than the rest of the world combined. By 2030 its wind and solar megabases are expected to reach roughly 455 GW. This is equivalent to the entire utility-scale wind and solar installed across the Americas as of early 2026. Managing that volume is a national infrastructure project rather than a market problem.
China State Grid plans to commission 15 new ultra-high-voltage (UHV) transmission lines between 2026 and 2030, adding roughly 200 GWh/year of renewable capacity to the grid and boosting cross-provincial transmission capacity by 35%. This can be compared to China’s high‑speed rail expansion where the government identified a critical bottleneck and then built through it at a scale and speed that fragmented and multi‑operator systems simply cannot match.
The Inner Mongolia Comparison: Curtailment Losses Still Reach $17 Billion
Inner Mongolia as a case study can be compared to Germany precisely because the renewable generation is concentrated far from population and industrial centers, requiring long-distance transmission to be usable at all times. However, this does not necessarily amount to China solving it all.
An independent analysis by the Center for Research on Energy and Clean Air found renewable curtailment losses concentrated specifically in Xinjiang, Inner Mongolia, Gansu, Hebei, Shandong, and Qinghai rose sharply through 2024-25, with the value of nationally lost generation estimated at around $17 billion. It was found that avoiding this curtailment would have made 2025 wind and solar output roughly 13% higher than reported.
China's strategy is treating curtailment as an infrastructure-and-coordination problem to be built through, at national scale and state-directed speed. Europe, fragmented across 27plus national regulators and grid operators, is reaching for market and software fixes to work around infrastructure it cannot build fast enough. However, it’s important to recognize that neither strategy has fully eliminated curtailment. They represent different ways of trying to close the same underlying gap.
Source-Grid-Load-Storage (SGLS) Planning: China's Coordinated Model
Beneath the transmission build-out in China, sits a planning approach that decides where that capacity should actually go. Source-Grid-Load-Storage (SGLS) coordinated planning jointly optimizes generation, transmission, demand-side flexibility, and storage investment in a single model. Rather than planning each layer separately and hoping they fit together, closer to how European national grids have historically been planned, one country and one layer at a time.
A 2026 case study applying SGLS optimization specifically to Xinjiang, China's largest renewable power export province, found it needs 16.89 GW of flexibility retrofits to existing thermal plants to accommodate planned renewable growth through 2050. The 16.89 GW figure was achieved because the model treats generation, storage, and grid investment as one connected decision rather than three separate ones.
China’s storage expansion has happened on a scale that Europe hasn’t come close to matching. In 2025 alone, the country installed 18.76 GW/65.46 GWhof new battery storage, a year‑on‑year jump of about 52% surpassing the full-year additions of the United States, the world’s second-largest market (Ember, 2026). Much of this surge was driven by the economics of curtailment in high‑renewable provinces such as Xinjiang and Inner Mongolia, where adding storage directly reduces wasted generation.
Whether Europe can adopt this kind of coordinated, state‑directed model is still uncertain. China treats generation, transmission, demand, and storage as one integrated system. Europe, by contrast, approaches these pieces separately and often nationally.
DATA CENTER GRID CONNECTION QUEUES: SAME CRISIS, DIFFERENT POLICY RESPONSE BY COUNTRY
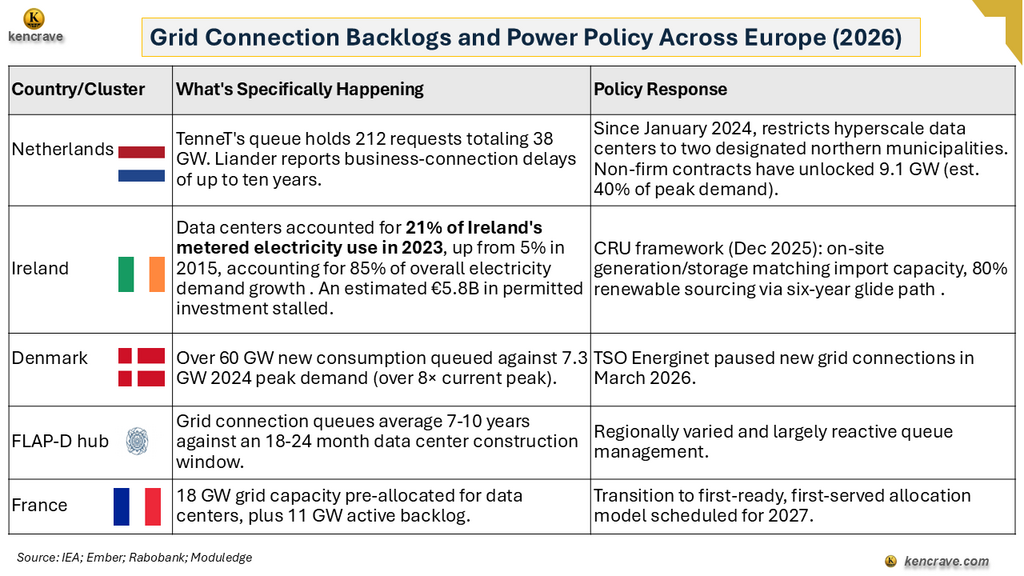
Data center and large-load connection queues make the country-specific pattern even clearer, because governments have responded with different tools, not a single EU policy.
Table of grid connection backlogs and power policy responses across Europe in 2026.
Country/cluster What's specifically happening Policy response
Netherlands TenneT's queue holds 212 requests totaling 38 GW. Liander reports business‑connection delays of up to ten years. Congestion may impose annual economic losses of up to €40 billion which is based on a single BCG/Ecorys estimate. Since January 2024, national policy restricts hyperscale data centers to two designated northern municipalities. Non‑firm contracts have released 9.1 GW of additional capacity which is equivalent to roughly 40 percent of national peak demand.
Data centers accounted for 21% of Ireland’s metered electricity use in 2023, up from 5% in 2015. An estimated €5.8billion in permitted investment is now stalled because the grid cannot accommodate additional load. CRU framework (Dec 2025) requires on-site generation/storage matching import capacity and 80% renewable sourcing via a six-year glide path.
Denmark Over 60 GW of new consumption queued against 7.3 GW of 2024 peak demand, over eight times current peak load. TSO Energinet paused new grid connections in March 2026.
FLAP-D hubs Grid connection queues average 7-10 years against an 18–24-month data center construction window. The policy response in this case is regionally varied and largely reactive queue management.
France has 18 GW of grid capacity pre-allocated specifically for data centers. However, official transmission data (RTE) shows a concrete backlog of 11 GW actively in the connection queue. The transition to afirst-ready, first-servedallocation model is scheduled for 2027.
According to Ember and Rabobank, Belgium, Portugal, Spain, the Nordics, and Italy report connection timelines that are significantly shorter than those in the FLAP‑D hubs.
THE AI COMPUTING CAPACITY GAP: EUROPE’S 4-5% SHARE VS. US 70%
Europe currently accounts for roughly 4-5% of global AI computing capacity. The United States holds an estimated 70%, with American hyperscalers controlling about 80% of that share. China captures most of the remainder at approximately 11%.
The grid constraint is not just about a technical inconvenience. Every year a data center project spends in a multi-year connection queue is a year of AI infrastructure capacity that doesn't get built in Europe. In contrast, US and Chinese capacity continues to compound. The connection queues in the Netherlands, Ireland, Denmark, and the FLAP-D hubs are a direct input into Europe's economic and digital-sovereignty position over the next decade.
The policies by the European countries show different approaches. The Netherlands is choosing demand-side exclusion (banning most new hyperscale build entirely). Ireland is choosing a supply obligation (forcing developers to bring their own generation and storage). Denmark chose a hard stop (pausing the queue altogether). France is choosing allocation by readiness rather than restriction.
The underlying constraint is continental, but the solutions being pursued are entirely national. Each country’s response is shaped by its grid‑ownership structure, its political tolerance for data‑center growth, and the amount of headroom available in its system.
Recognizing these varied approaches enable the policymakers and investors to identify tailored solutions rather than assuming a single EU fix exists.
Unlocking Data Center Flexibility: Up to €1.7 Billion in Annual Savings
A 2026 Deloitte analysis modeled data‑center flexibility across Europe. It found that even limited, well‑targeted flexibility where data centers shift or shed load only during rare periods of system stress, rather than drawing power at a constant rate year‑round, can deliver substantial benefits.
The study estimated annual savings of up to €1.7 billion for the European power system. It also projected a reduction of roughly 5megatonnes of CO₂ emissions. These gains come from avoiding the need to build peak thermal generation capacity that would otherwise sit idle for most of the year.
The policy mechanism Deloitte and others point to is the Flexible Connection Agreement (FCA). Instead of requiring a data center to wait 7-10 years for a firm, always-on grid connection, an FCA offers a much faster connection in exchange for the data center agreeing to reduce or shift its electricity draw during a limited number of predefined grid-stress hours per year.
TenneT's non-firm connection contracts in the Netherlands, which have already unlocked 9.1 GW which is roughly 40% of national peak demand, are a working example of this principle already in commercial use. Deloitte models two versions: a Mandated Flexibility scenario, where data centers commit to fixed load reductions during system peaks in exchange for faster connections, and a more ambitious Open-EU Flexibility scenario, where data centers continuously adjust demand in real time to match system conditions.
Both measures reduce the amount of new generation and transmission capacity the system would otherwise need to build. That directly addresses the build‑time mismatch problem outlined at the start of this analysis. Deloitte's own analysis attributes the gap between this potential and actual deployment mainly to inconsistent connection-agreement rules and weak price signals across national markets, not to any unresolved engineering question.
EU’S JUNE 2026 ANSWER: AI & DIGITALIZATION ROADMAP (COM (2026) 501) QUANTIFIED
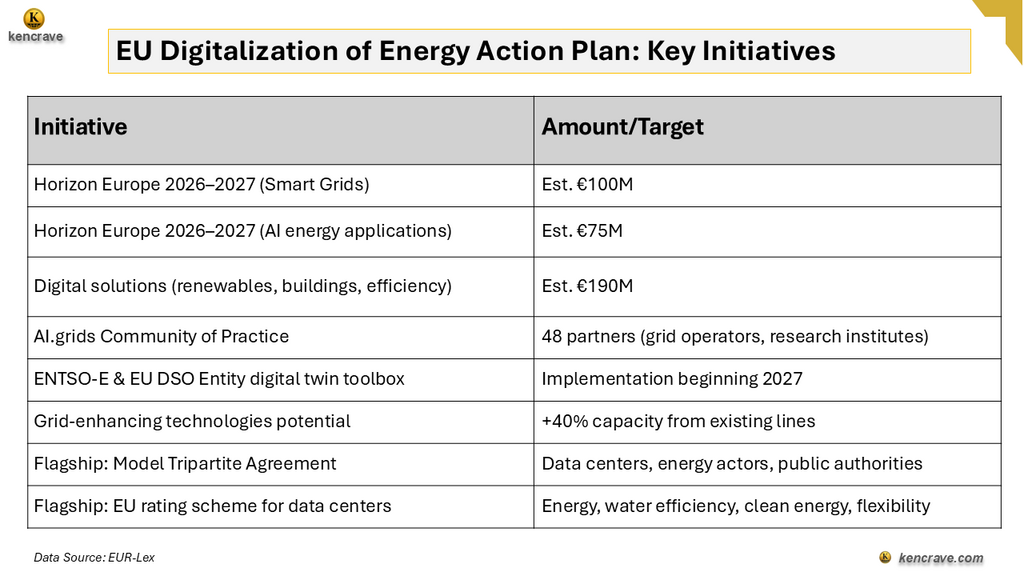
On 3 June 2026, the European Commission adopted the Strategic Roadmap for Digitalization and AI in the Energy Sector (COM (2026) 501), part of a wider Technological Sovereignty Package. Unlike the country‑level measures described above, this is a genuinely EU‑wide instrument. Its underlying logic, however, is the same. It extracts more capacity from the infrastructure that already exists, because new capacity cannot be built fast enough to close the gap.
Accelerating AI deployment for electricity grid optimization
Improving energy efficiency in buildings and industry
Enabling demand-side flexibility
EU digitalization of energy action plan table listing smart grid and AI funding initiatives.
What This Means
The mismatch is structural, not cyclical. Germany's curtailment rate roughly doubled year over year because the underlying cause does not resolve itself without new infrastructure that takes 5-15 years to deliver.
Weather can hide the trend for a year, not reverse it. The 2026 Nordic curtailment dip shows how a single hydro year can flatter or worsen the headline number without changing the structural picture. Multi-year, single-country trends provide more reliable signals.
National responses are diverging. The Netherlands, Ireland, and Denmark are running three different real-world policy experiments on the same underlying constraint.
AI/digitalization is a rate-of-fix argument, not an efficiency argument. The EU is funding grid AI because software can be deployed in months, while it takes a decade to develop the transmission lines.
COMMERCIAL OPPORTUNITY & VALUE CREATION: WHERE EUROPE’S GRID BOTTLENECK CREATES BUSINESS VALUE
Europe’s grid bottleneck is not only an infrastructure challenge, but also creating a growing commercial market for technologies, services, and business models that increase usable grid capacity, reduce curtailment, accelerate electricity connections, and improve demand flexibility. The opportunity is not concentrated in a single technology.
It cuts across an ecosystem of battery storage, grid-enhancing technologies, flexible connection agreements, demand response, AI-enabled forecasting, digital twins, and energy-management systems. The central commercial shift is clear. As electricity infrastructure becomes constrained, value increasingly moves toward whatever makes existing infrastructure more productive, flexible, and intelligent.
a.) Renewable Curtailment: Creating Value from Stalled Electricity
Europe’s rapid renewable expansion is increasingly producing periods when generation exceeds the grid’s ability to transport or absorb it. The 72 TWh curtailed and €8.9 billion in congestion costs documented earlier in this analysis and Germany’s curtailment rate nearly doubling from 1.9% to 3.1% (9.6 TWh) in a single year.
The businesses most directly exposed are solar and wind developers, renewable asset owners, utilities, energy traders, and battery-storage developers. Without additional flexibility, curtailed generation is simply lost or sold at a loss or not monetized at all.
With battery storage, hybrid renewable-plus-storage projects, flexible demand, or better forecasting and dispatch, that same generation can instead be shifted or absorbed which would increase how much of what’s generated actually gets used. The value created can be tracked through curtailment rate, MWh captured or shifted, revenue per MWh or per MW of installed capacity, battery utilization, and reduction in congestion-related losses.
As curtailment rises, a renewable asset’s commercial value depends less on how much it can generate and more on how much of that generation can be delivered, stored, or consumed at a commercially useful time. This represents a stronger case for developers to evaluate storage and flexibility alongside generation capacity, rather than as a separate decision.
b.) Grid-Enhancing Technologies (GETs): 40% More Capacity from Existing Lines
The build-time mismatch of 1-5 years for renewables against 5-15 for transmission creates a direct commercial opportunity for technologies that increase the effective capacity of infrastructure that already exists. The EU’s own digitalization and grid-enhancing technology strategy identifies a possible 40% increase in grid capacity at lower cost than some forms of conventional expansion.
The likely customers are TSOs, DSOs, renewable developers, infrastructure investors, and engineering companies. The relevant technologies include dynamic line rating, advanced grid monitoring, and power-flow or network topology optimization.
The traditional response to congestion is to build more infrastructure. The emerging commercial question is how much additional electricity can be safely moved through what already exists before new infrastructure becomes unavoidable.
Value is created if a technology increases usable capacity, reduces congestion, or delays some reinforcement requirements measurable through additional MW of usable capacity, reduced congestion costs, higher transmission utilization, projects connected, capital expenditure deferred, and connection time saved. These technologies act as complementary to grid expansion, buying time while physical build-out catches up with renewable deployment, not a replacement for it.
c.) Flexible Connections: Fast-Tracking Grid Access for Data Centers & Industry
Grid connection queues are increasingly a barrier to business expansion, particularly for electricity-intensive industries. The Netherlands’ 212 requests for 38 GW and waits of up to ten years, against 9.1 GW already unlocked through non-firm connection arrangements; Ireland’s data centers consuming roughly 21% of metered electricity while billions of euros in permitted investment are constrained.
The emerging model is the flexible, or non-firm, connection agreement. This enables a customer to gain faster access to capacity in exchange for reducing, shifting, or managing demand during defined periods of grid stress. Without flexibility, a grid constraint turns into a connection queue, then into project delays, and ultimately into delayed revenue. With flexibility, demand can shift, enabling earlier connection, earlier commissioning, and potentially earlier commercial operation.
The value isn’t only about lowering electricity costs but it’s time saved accessing essential infrastructure. This is measurable through months of connection time avoided, MW secured, revenue brought forward, the cost of the flexibility infrastructure itself, the cost of alternative onsite power, and any flexibility payments received. For electricity-intensive businesses and particularly data centers and AI infrastructure, flexibility is becoming an infrastructure-access strategy as much as an energy-management one.
d.) Data-Center Flexibility: A New Energy & Digital Infrastructure Opportunity, With a Caveat
AI and cloud growth is increasing demand for data-center capacity. At the same time, electricity infrastructure is emerging as a constraint on that expansion. Modeling cited earlier in this analysis suggests increased flexibility from European data centers could generate up to €1.7 billion in annual power-system savings and avoid roughly 5 Mt of CO2. The €1.7 billion is a modeled system-wide benefit. It's not revenue that an individual data-center operator or technology provider would receive.
The system-level value comes from reduced peak demand, less pressure on grid infrastructure, lower balancing requirements, and more efficient use of existing infrastructure. How much of that value an individual business can actually capture depends on market design, flexibility contracts, electricity pricing, grid connection agreements, and who owns the storage or demand-response assets involved.
AI infrastructure growth may therefore create an unexpected market for energy flexibility. Businesses that can combine digital infrastructure with intelligent electricity management stand to gain a competitive advantage as grid capacity becomes scarce.
e.) AI Forecasting & Grid Optimization: Better Data Drives Operational Value
AI’s commercial relevance in the electricity system isn’t that it introduces automation. It's whether improved forecasting or optimization actually leads to better operational decisions. This analysis treats AI and digitalization as potentially important levers because digital systems can in principle be deployed faster than physical infrastructure.
Likely customers include TSOs, DSOs, utilities, renewable asset operators, energy traders, and energy-management companies, applying AI to generation and demand forecasting, grid optimization, predictive maintenance, advanced distribution management, and energy-management software.
Better data leads to better forecasting, which leads to better operational decisions, which improves asset utilization and reduces uncertainty. The benefits potentially include improved scheduling, better balancing decisions, reduced forecast uncertainty, better renewable integration, and faster operator response. The relevant metrics are forecast error, balancing costs, redispatch requirements, renewable and asset utilization, and operator response time.
The real commercial question isn’t whether AI can improve forecasting. It's which specific operational decision it improves, by how much, and whether that improvement creates measurable economic value for a paying customer.
That distinction will matter more as the market moves from experimentation toward commercially deployable applications.
f.) Digital Twins: Faster, Better Infrastructure Decisions
As electricity systems become more decentralized and complex, modeling the impact of new generation, demand, and storage assets before committing capital becomes harder. This is why the European grid strategy includes building digital-twin capability jointly through ENTSO-E and the EU DSO Entity. Likely customers are transmission and distribution operators, renewable developers, engineering consultancies, and grid software providers.
Digital twins let physical infrastructure be modeled and tested in a digital environment before construction. This replaces a traditional cycle of physical infrastructure proposals, complex engineering studies, potential redesign, and long decision cycles with digital simulation, scenario testing, and earlier identification of constraints. The value shows up when there are fewer engineering hours, shorter planning cycles, more connection studies completed per year, more projects assessed, redesign costs avoided, and less time needed to identify network constraints.
The commercial opportunity sits at the intersection of energy infrastructure, engineering, and software and the value proposition isn’t the digital model itself, but the better decisions it enables.
g.) Industrial Energy Flexibility: From Cost Center to Competitive Capability
Electricity-intensive industries such as manufacturing, food processing, cold storage, chemicals, cement, steel, and large commercial facilities face growing exposure to grid congestion. They are also exposed to price volatility including the very low or negative prices during renewable oversupply and the price spikes that follow once conditions change. Businesses that can shift non-critical demand toward lower-price periods, through onsite renewable generation, battery storage, demand response, intelligent energy management, or flexible industrial processes, can reduce that exposure.
Additional value can come from lower peak‑demand costs, improved resilience, reduced reliance on constrained grid capacity, and participation in flexibility markets. These benefits are typically measured through €/MWh saved, peak demand reduced, the share of electricity shifted, gains in energy self‑sufficiency, downtime avoided, and flexibility revenue earned.
For energy-intensive businesses, electricity flexibility is increasingly becoming a competitive capability not just an operational energy-management tool.
The Business Case Test: Criteria for a Viable Grid Tech Investment
Is the problem significant? Is there evidence of material congestion, curtailment, connection delay, or financial loss?
Is the problem persistent or growing? Is the issue structural, or caused by temporary conditions?
Is there an identifiable customer experiencing the problem? Can the affected organization be clearly identified?
Is there a deployable solution? Can the technology or service realistically address the bottleneck?
Is the value measurable? Can the benefit be measured in MW, MWh, €, time saved, or risk reduced?
Is there a mechanism for value capture? Can the solution provider earn revenue through contracts, software fees, energy markets, engineering services, or infrastructure ownership?
What could cause the business case to fail? Do the potential risks include regulatory change, high capital costs, weak market incentives, competing technologies, or physical grid expansion arriving faster than expected.
STRATEGIC RECOMMENDATIONS: ACTIONABLE STEPS FOR ENGINEERS, INVESTORS, AND DECISION-MAKERS
Europe’s grid bottleneck is shifting where economic value gets created in the electricity system. The original question does Europe have enough generation capacity has been replaced by a question of operability: how electricity can be moved, stored, forecast, controlled, and consumed within infrastructure that’s struggling to expand fast enough.
For Engineers & Technical Professionals:
Build Power-Systems & AI Fluency
The scarce, premium-compensated profile identified earlier (power-systems fundamentals and data/AI fluency) is not speculative. It’s the specific skill combination the EU's own €175M in 2026-27 Horizon funding is being spent to develop tooling around. Building visible expertise at that intersection, rather than in either discipline alone, is the highest-leverage individual response.
For Investors & Business Decision-Makers:
Track the Netherlands, Ireland & Denmark as Natural Experiments
Treat the Netherlands, Ireland, and Denmark as three experiments in grid-bottleneck policy and not settled policy outcomes. Watching which model produces the least stalled capital and the fastest connection times over 2026-2028 is a trackable signal to identify where regulatory risk is lowest for grid-adjacent investment in Europe.
Bottom Line: Europe’s Absorption Shortage is the Root of Curtailment, Volatility & Queue Crises
Europe does not have a renewable energy shortage. It has an absorption shortage, and every data point in this analysis traces back to that single structural fact. Curtailment, price volatility, multi-year data center queues, and the EU's own AI and digitalization roadmap are not five separate issues. They are five symptoms of the same build-time mismatch between how fast generation can be added and how slowly grid infrastructure can follow.
Until that gap closes, whether through new transmission, smarter use of existing infrastructure, or both, Europe will continue producing record amounts of clean power that it cannot fully use. At the same time, it will pay record prices for the gas plants required to fill in around those unused renewables.
Key Summary: The binding constraint on Europe's energy transition has shifted from generation to grid absorption, and the EU's 2026 bet on AI and digitalization is a rate-of-fix response to a timeline problem that money alone cannot solve faster.
Key Takeaways
Grid infrastructure takes 5-15 years to build against 1-5 years for generation. This asymmetry is the root cause of curtailment and congestion and not a shortage of panels or turbines.
Curtailment is a concrete, country‑level operational issue, not an abstract continental trend. Germany’s curtailment rate nearly doubled in a single year, while Nordic curtailment fell for weather‑related reasons rather than policy changes.
National responses to data center queues are diverging into genuinely different policy bets such as exclusion (Netherlands), supply obligation (Ireland), a hard pause (Denmark), and readiness-based allocation (France).
China's infrastructure-first strategy has not eliminated curtailment fully.
Europe's AI compute capacity gap (4-5% versus the US's 70%) means the grid bottleneck is a competitiveness and digital-sovereignty issue, not only a technical one.
Sources
This analysis draws on primary institutional data, industry research, and specialist media reporting, triangulated across sources to distinguish structural trends from temporary fluctuations. Primary sources from regulators, TSOs, and official EU documents are prioritized.