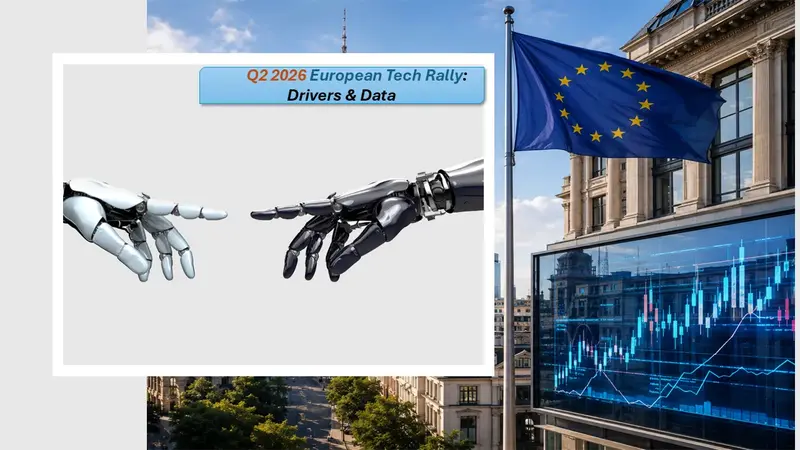
Robotic hands symbolizing AI innovation beside the EU flag and stock chart, representing Europe’s technology driven market surge. Image Credits: Kenneth via Kencrave
14 min read
Markets
European Market Outlook 2026: Stoxx 600 +10% Tech Rally & Strategy
European markets recorded their strongest quarter since 2020, with the STOXX 600 rising 10% in 2nd quarter 2026, driven by an AI-fueled tech surge (+37%-40%).
While Europe trailed the US (+16%) and Asia (+20%), its tech sector outperformed US tech in percentage terms. Key risks for the 3rd quarter 2026 include oil price volatility, AI sustainability concerns, and persistent inflation
European Market Recovery: Tech Momentum, Fiscal Strength, and Strategic Growth
European markets had a remarkable turnaround in the second quarter of 2026. After a turbulent start to 2026 marked by an oil price shock and geopolitical uncertainty, major indices surged, with technology, financials, and industrials leading the charge.
The Morningstar Europe Index ended the quarter up more than 10% in dollar terms, while the pan-European STOXX 600 index climbed 10%, its biggest quarterly gain since October 2020.
What made this rally different from previous ones? Unlike the broad-based U.S. rally driven by some big-cap tech stocks like Nvidia, Europe's recovery was powered by a combination of AI enthusiasm, a resilient banking sector, and a rebound in cyclical industries.
Yet the continent's smaller exposure to technology meant its gains, while impressive, were inferior to the tech-heavy US Market Index (up est. 16%) and the Asia Index (up est. 20%).
Italian stocks outperformed regional benchmarks, fueled by substantial gains in the banking sector following a wave of mergers and acquisitions activity.
Country-level performance revealed a mixed picture. Germany's DAX led the major national benchmarks with gains of around 9-10% for the quarter, while France's CAC 40 also rose by roughly 9%, though weakness in some consumer, software, and defence sectors limited its progress.
The Netherlands was the standout performer, gaining 33% thanks to index heavyweight ASML. Italy and Spain both gained around 15%, supported by strong moves in cyclical and financial stocks.
London's FTSE 100 lagged behind its continental peers, as investors remained cautious about UK equities due to persistent concerns over a growing fiscal deficit and sluggish economic growth.
Table comparing major European stock indices, highlighting Netherlands AEX (+33%) as top performer.
Europe’s Sector Performance: Winners and Losers
a.) Technologywas the clear winner, with the European tech sector rising by approximately 37%-40% over the period. Germany's Infineon Technologies soared over 100%, while the Netherlands' ASML gained 53% as the sector benefited from the AI capital expenditure boom.
The STOXX 600 technology sector recorded its biggest quarterly jump since October 2001, underscoring robust demand for AI infrastructure.
b.) Financials also performed strongly, rising around 18% in dollar terms. Banks benefited from better sentiment, higher trading revenues, and a wave of mergers and acquisitions activity in Italy.
c.) Industrials gained approximately 12-14%, supported by expectations for steady demand and improving confidence in the economic outlook.
d.) Energy was the biggest laggard, falling 15% as investors bet on a de-escalation in Middle East hostilities and the reopening of the Strait of Hormuz. British Petroleum (BP) and Equinor both shed more than 20%.
Shell's gas-trading division, however, reported significantly higher results, benefiting from volatility triggered by the conflict.
Chart showing technology sector (+40%) leading Europe’s quarterly growth, with energy (‑15%) lagging.
Q2 2026 European Tech & Semiconductor Leaders: Top Market Performers
European semiconductor stocks recorded a historic rally in second quarter of 2026, with the average stock in the sector gaining 69%, according to Jefferies.The technology sector as a whole surged approximately 37% to 40% for the quarter, achieving its largest quarterly gain since October 2001.
This performance comfortably beat the S&P 500 tech sector and highlighted a sharp rotation into European semiconductor names, even as the broader European indices lagged behind the overall US and Asian benchmarks.
This performance in Europe was driven by sustained demand for artificial intelligence infrastructure and easing geopolitical tensions.
Top five European Chip Stock performers of the quarter, based on data from the Jefferies report.
Semiconductor companies like Soitec and STMicroelectronics show triple‑digit gains driven by AI and data‑center demand.
Nokia also delivered a strong performance during the quarter as it benefited from its strong position in optical networks and data centre infrastructure supporting AI growth.
It's worth noting that the rally in semiconductor stocks extended into early July before experiencing a correction, following Samsung Electronics' record earnings report which triggered a sector-wide selloff as European investors question the sustainability of the AI-driven rally.
Drivers of Europe’s Q2 Rally: AI Boom, Oil Shock Easing, and Central Bank Policy
i. The AI and Semiconductor Surge
The driving force behind Europe's Q2 rally was the same as in the U.S. and Asia: artificial intelligence. While Europe has fewer pure-play AI companies, its semiconductor and equipment makers were at the heart of the rally.
Infineon's more-than-doubling and ASML's 53% gain reflected strong demand for chip supply chains and the infrastructure needed to support AI growth.
ii. The Oil Shock Aftermath
The quarter began with markets reeling from an oil price shock. Brent crude had spiked above $119 in March due to Middle East conflict, fueling fears of stagflation.
However, as ceasefire talks progressed and tensions eased, oil prices retreated, with WTI crude stabilizing below $100. This easing reduced inflationary fears and supported cyclical sectors.
iii. Central Bank Policy and Inflation Dynamics
The European Central Bank raised its key interest rates by 25 basis points at the June meeting, responding to a spike in inflation driven by the Middle East conflict. ECB President Christine Lagarde noted that while the war had dented confidence and pushed up energy costs, the central bank remained confident that inflation would return to target with appropriate policy action. The Eurosystem staff projections foresee headline inflation at 3.0% in 2026, declining to 2.0% in 2028.
Eurozone inflation rose to 3.2% in May, driven by energy inflation above 10%.
However, the ECB's Survey of Professional Forecasters showed that while near-term inflation expectations were revised upwards, longer-term expectations remained anchored at 2.0%. The ECB's June 2026 staff projections saw real GDP growth at 0.8% in 2026, 1.2% in 2027, and 1.5% in 2028.
iv. Corporate Earnings Resilience
Corporate earnings broadly exceeded forecasts, providing a solid foundation for the rally. Banks benefited from strong trading revenues and capital markets activity. Industrials were supported by infrastructure spending and reshoring trends. Siemens Energy reiterated strong demand trends at its quarterly earnings call.
Bar chart comparing index and sector gains across Europe; AEX (+33%) and Technology (+40%) lead growth while Energy (‑15%) declines.
Global Market Comparison: Europe vs Africa, North America, and Asia
Bar chart comparing Q2 2026 stock market performance. Europe rose 10%, while North America gained 16%, and Asia led with a 20% gain.
i. Europe vs. Africa
African equity markets presented a contrasting picture during Q2 2026. While European markets surged on AI optimism and easing oil prices, Johannesburg Stock Exchange (JSE) remained more in stagnation zone.
The JSE All‑Share Index, Africa’s largest and most liquid market, was weighed down by persistent weakness in mining stocks as global commodity prices struggled to find clear direction.
In contrast to JSE, the Nairobi Securities Exchange (NSE) broke away from regional stagnation to a powerful rally. The NSE was driven by a stabilizing Kenyan Shilling and aggressive foreign and domestic inflows into major blue chips like Safaricom and the banking sector. The NSE emerged as one of the region's top performers, despite Kenya’s fiscal concerns.
Meanwhile, African energy companies, including Nigeria’s Seplat Energy and Kenya’s KenGen, showed resilience, benefiting from elevated oil and gas prices that stabilized during the quarter.
However, liquidity constraints and limited foreign investor participation continued to cap the broader market’s upside, underscoring the structural challenges that keep African equity markets being excluded on the global capital flows.
For European investors, this divergence underscores the value of geographical diversification; while European energy majors like Shell and BP felt the pinch from falling oil prices, African energy producers offered a natural hedge due to their direct commodity-price leverage.
ii. Europe vs. North America
Overall, the European broad-market indexes trailed their U.S. counterparts during Q2. The Morningstar US Market Index gained roughly 15.5%, heavily outpacing Europe's broad STOXX 600, which managed about 10%. The primary differentiator remains structural technology concentration.
The U.S. market is driven by trillion-dollar mega-caps like Nvidia, Microsoft, and Apple, which directly benefited from the artificial intelligence wave despite a slow momentum due to Investor sentiment on AI earnings sustainability. Europe's aggregate market, by contrast, is heavily weighted toward traditional financials, industrials, and consumer luxury.
However, European tech outperformed U.S. tech in percentage terms during the quarter, as investors rotated into cheaper European names.
The STOXX 600 technology sector rose over 30% for the quarter, surpassing the S&P 500 tech sector's 26.20% gain.
iii. Europe vs. Asia
Asia's rally was even more pronounced than Europe's, with the Morningstar Asia Index gaining about 20%. Asian markets, particularly those with heavy technology exposure (Taiwan, South Korea), directly benefited from the AI infrastructure boom.
The performance gap reflects different sector compositions with Asia having more direct exposure to semiconductor manufacturing and AI supply chains.
Europe's technology sector is more focused on equipment and industrial applications (such as ASML's lithography systems supplying Asia's massive foundries).
Central Bank Policy Divergence: ECB vs Bank of England Strategies
European Central Bank
The ECB raised rates by 25 basis points in June, responding to the inflation spike. ECB President Lagarde emphasized that the decision was robust across various scenarios and that the central bank would remain data-dependent and meeting-by-meeting. The Eurosystem staff projections foresee headline inflation at 3.0% in 2026, 2.3% in 2027, and 2.0% in 2028.
The ECB's updated strategy, adopted after its 2025 strategy assessment, guides its response to supply shocks. It rests on three principles: assessing the nature of the supply shock, focusing on risks around the baseline, and ensuring a tailored and graduated policy response.
The central bank is currently in a "second case" scenario, where the shock is too large to look through but not yet causing self-reinforcing dynamics requiring a more forceful response.
Bank of England
The Bank of England, facing similar inflation pressures, signaled readiness to hike rates. S&P Global Ratings revised its baseline, no longer expecting a rate cut this year but anticipating one to two rate hikes, though the energy bill passed in the November budget will cap price increases until late 2026.
Key Risks for the Second Half of 2026
1. Oil Price Volatility and Geopolitical Risk
Despite April's easing, the Middle East conflict remains the most significant macro risk. Any renewed escalation like recent incidents (early July 2026) could quickly reverse progress, pushing Brent crude back towards higher prices and reviving stagflation fears.
Shell has warned that the conflict's impact on energy markets is uneven, with traders benefiting from volatility but gas output suffering from lost Qatari volumes.
2. Sustainability of the Tech-Led Rally
Investors remain hesitant on AI sustainability, durable pricing power, and proof that AI demand is still accelerating. A disappointment in the next earnings cycle could undermine broader sentiment.
3. Inflation Persistence and Central Bank Divergence
As Europe moves into the second half of 2026, inflation remains a major concern. Headline price spikes have eased, but core inflation is still stubborn, keeping the European Central Bank (ECB) cautious. The ECB expects inflation to stay around 3% this year, but shocks from geopolitics or supply chains could push it back toward 5%.
This persistent inflation is forcing Europe to keep interest rates higher for longer, unlike other central banks that are cutting. The tight policy is likely to pressure company profits, slow manufacturing, and weigh on traditional non-tech stocks through year-end.
4. Consumer and Credit Fragility
While markets rallied, underlying consumer and credit conditions remain fragile. Mid- and low-income households face pressure from elevated service and food inflation. Higher borrowing costs among small businesses pose risks to financial stability.
If labor market momentum softens or inflation persists, consumer-facing sectors and credit-sensitive industries could experience renewed stress.
Infographic outlining AI and semiconductor surge, easing oil shock, and risks such as inflation and tech‑rally sustainability.
Q3 2026 Investment Strategy: Growth Opportunities, Risk Management, and Sector Insights
1. Maintain Exposure to High-Quality Growth
The second quarter rally was driven by exceptional results in AI, semiconductors, and cloud infrastructure. These areas remain structurally supported by long-term demand, but expectations are now elevated. Investors may benefit from focusing on companies with strong balance sheets, clarity on AI-related revenue streams, and proven pricing power.
2. Balance Portfolios with Cyclical and Defensive Assets
With inflation still sticky and geopolitical risks unresolved, diversification across cyclical and defensive sectors still remains important. Industrials, energy infrastructure, and materials continue to benefit from reshoring, grid modernization, and infrastructure spending.
Defensive sectors such as healthcare and consumer staples could cushion the portfolio if consumer spending weakens.
3. Monitor Rate-Sensitive Areas
The ECB's rate hike and potential for further tightening affect rate-sensitive sectors like utilities, REITs, and highly leveraged companies. Watch for opportunities in financials benefiting from trading activity and stable credit conditions.
4. Stay Selective in Consumer-Facing Sectors
Consumer conditions remain uneven, with mid-income households still pressured by elevated service and food inflation. Investors could consider focusing on companies with strong brand loyalty, pricing power, and exposure to essential goods or services.
Key Takeaways
1. Strongest Quarter Since 2020: European markets recorded their best quarterly performance in over five years, with the STOXX 600 rising 10%.
2. Tech and AI Driving Rally: European tech stocks surged almost 40%, with Infineon more than doubling and ASML gaining 53%.
3. Oil Shock Eases, but Risks Remain: Brent crude stabilized below $100, but Middle East tensions continue to pose a significant risk.
4. ECB Raises Rates: The ECB hiked rates by 25 basis points in June, responding to a spike in inflation.
5. Europe Trails US and Asia: European gains were outpaced by the US (16%) and Asia (20%), reflecting lower tech concentration.
Frequently Asked Questions
1. Why did European tech stocks outperform US tech in Q2 2026?
European tech stocks were seen as cheaper and played catch-up with U.S. peers. The STOXX 600 technology sector rose almost 40% for the quarter, surpassing the S&P 500 tech sector's 26.20% gain, as investors rotated into European names at a 'relative discount'.
2. How did the Middle East war affect European markets?
The war initially triggered an oil price shock, pushing Brent crude above $119 in March and fueling stagflation fears. However, as tensions eased and peace talks progressed, oil prices retreated, supporting the Q2 rally. The conflict's volatility also benefited energy traders at companies like Shell.
3. What is the outlook for ECB policy?
The ECB raised rates by 25 basis points in June and signaled a data-dependent approach. Markets anticipate another 25-basis-point hike by year-end, though the trajectory depends on inflation and growth data.
4. Which sectors outperformed in Q2 2026?
Technology (+est.37%-40%), financials (+18%), industrials (+12%), and travel & leisure (+19%) led gains. Energy was the biggest laggard, falling 15%.
5. How did European markets compare with global peers?
European broad-market indexes (STOXX 600 +10%) underperformed both the S&P 500 (+est.16%) and Asian indexes (+20%) for the quarter, reflecting Europe's lower concentration in mega-cap tech. However, the European technology sector (+est.37%-40%) notably outperformed the S&P 500 tech sector (+26.2%) as investors rotated into relatively cheaper European AI and semiconductor names.